
go back
There are so many processes and workflows that run in the background to keep our businesses running smoothly. And it can be so easy to get lost in analyzing all of the information generated by them. From tracking projects and tasks, managing a team, and recording sales or leads, ClickUp’s Dashboard feature can do it all.
Around here, we don’t like to gatekeep when it comes to tools that can revolutionize how you do business. You’ve heard us rant and rave (several times!) about ClickUp as our #1 project management tool; Dashboards are just one of our favourite features that ClickUp offers (it’s a close tie for first with ClickUp’s Custom Fields!). They help segment and compartmentalize areas of your business so all the extra noise gets filtered out, and you can easily discover the important information you need to know.
Pin this blog for later! ↓
Please note that some links in this blog post are affiliate links, which means we may receive a commission if you purchase using our link. Honestly, we just love sharing what we’ve been loving lately, and if that means you can get in on the sweet deals as well, then great!
What is a ClickUp Dashboard?
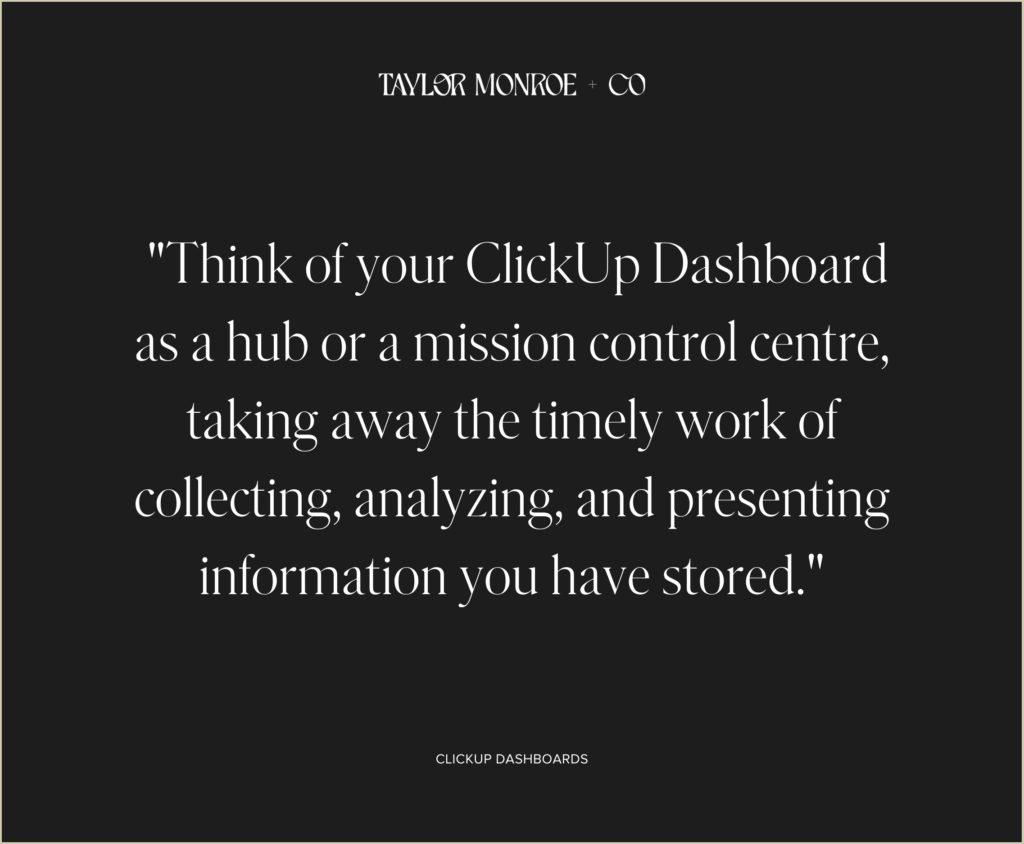
Think of your ClickUp Dashboard as a hub or a mission control centre for an area of your business. Your Dashboard takes away the timely work of collecting, analyzing, and presenting information stored in your project management system. You can have a summary of your tasks, updates on projects, track Goals, view Sprint progress, or even chart sales. Your Dashboard is also a great place to include hyperlinks or buttons to important things like shared Google Drive folders, your Slack workspace, or a meeting scheduler (though we personally use Dubsado’s internal scheduler + Zoom). Dashboards exist to help you avoid getting bogged down in the minute details that go into running your business behind the scenes.
When it comes to different projects or areas of your business, you can even create multiple Dashboards to track relevant information and easily view project details at a glance. For example, a wedding photographer can have Dashboards for post-processing after a wedding and for assigning when second shooters are requested in addition to their overall business reporting Dashboard. Plus, as your team grows and your goals change, ClickUp Dashboards are there every step of the way. Thanks to Widgets and Cards, Dashboards are both a task manager and reporter all in one and can easily be updated, so all the information presented is exactly what you want and need to see (and nothing else).
Using Widgets and Building Your Dashboard
Before creating your first Dashboard, it’s crucial to figure out what problem you’re trying to solve. Having an idea of this ahead of time will help you define your Dashboard’s purpose (and make sure you don’t abandon it after a week!). It will also help you decide what information is necessary for you to assess that problem and create the data story that your Dashboard will show. From there, we suggest you make a list of relevant information that you need to support your data story and choose the right Widgets to give you that information.
Every Dashboard will look different, and it really all comes down to the Widgets you use. Widgets, sometimes called Cards, provide the actual information on your Dashboard. Depending on your ClickUp plan, you can access different types of Widgets. (We’ll do a breakdown of our favourite Widgets coming up.) Once you choose your Widget, it creates a panel on your Dashboard that you can resize and drag and drop wherever you want it to be.
Now, to add a bit of creativity (and since you know we’re sticklers for branding), by adding images, you can customize your Dashboard with your logo or branded graphics. To do this, simply add a text block and type “/attachment” to upload any image. You can also rename any card on your Dashboard to fit in with your brand voice.
Pro tip: Enable “Me Mode” on cards on shared dashboards to create filters that will automatically show data that pertains only to the person viewing it. This way, you won’t have to set filters to see your tasks every time you view the Dashboard or create dashboards for every team member. (P.S. This can also be used in Views too!)
Best Widgets to Include on Your Dashboard
Now that you’ve been introduced to Widgets, here are some that we recommend most, especially when working with a team.
Table Widgets
This is our most used type of Widget! It’s great for segmenting tasks within your workspace, whether by assignee, location, tag, or due dates. You can see a variety of data, such as:
- Task List: Allows you to create a List view of tasks from any location.
- Completed Report: Break down all completed tasks by assignee.
- Worked On: View exactly what tasks team members have worked on based on activity.
- Workspace Points: Discover superstar team members based on how they communicate, check tasks, and their output.
- Who’s Behind: Gives you a snapshot of who is behind on their tasks and notifications.
- Activity View: Create an exact overview of activity based on the specific information you need.
Time Tracking Widgets
Time tracking cards are designed for all of your time reporting needs. These cards are available on all paid ClickUp plans and are perfect if you have team members who work hourly or if you want to track how long a new task takes.
The types of customizable time tracking cards include:
- Time Reporting: This includes all of your tracked time entries within a particular period. You can filter information in different ways and display it in custom groups.
- Timesheet: The Timesheet is a great card for service providers wanting to keep track of team members’ weekly or monthly hours in one convenient location. You can even choose to use a custom time range – it’s fully customizable to your needs!
- Billable Report: This card will show only billable time in a quick, easy-to-access report (vs a Time Reporting card, which shows both billable and non-billable).
Status Widgets
These widgets provide an overview of how Statuses are used in your workspace in chart format. This can help team members see how much time is spent on tasks and adjust as needed. There are several different ways to view status widgets. These are our favourite options:
- Workload by Status: Your tasks are broken down into a pie, battery, or bar chart to show how many tasks you have in each status.
- Status Over Time: Track the number of tasks under a specific status. You can even filter results based on your desired time range.
- Number of Tasks: You can keep an eye on statuses and tasks that are In Progress, Completed, or Closed.
- Time in Status: You can view the amount of time spent on each task to know what needs tweaking and what works well.
Assignee Cards
Assignee cards can help you better manage your team’s workload and will show you tasks your team is working on (or that have yet to be assigned). They can be viewed in three ways:
- By Assignee: This will allow you to view the tasks assigned to each person formatted in a pie, bar, or battery chart.
- Unassigned Tasks: This allows you to see how many tasks have yet to be assigned in a specific location in ClickUp.
- Total Assigned (Not Completed) Tasks: This will show you how many tasks have been assigned but not completed in a specific Space, Folder, or List.
Embed Widgets
With Embed widgets, you can incorporate tools and platforms outside of ClickUp to create a central hub for all of the information that keeps your business running. While there are so many options, the ones we use most often are Google Docs, YouTube, and the general “embed” option.
Custom Widgets
Create custom line charts, bar charts, pie charts, battery charts, calculation cards, portfolio cards, text block cards, and chat cards for your specific business needs. As we mentioned earlier, some cards, like text blocks, can even be used to add your branding to your Dashboard.
What’s New in ClickUp 3.0 Update?
If you’re one of the lucky ClickUp users who has been upgraded with the new 3.0 update, you’ll be excited to see that ClickUp has added a few cool new features to Dashboards and moved the Dashboard Hub to a more prominent location.
First, let’s take a look at where to find and create Dashboards for both 2.0 and 3.0 users:
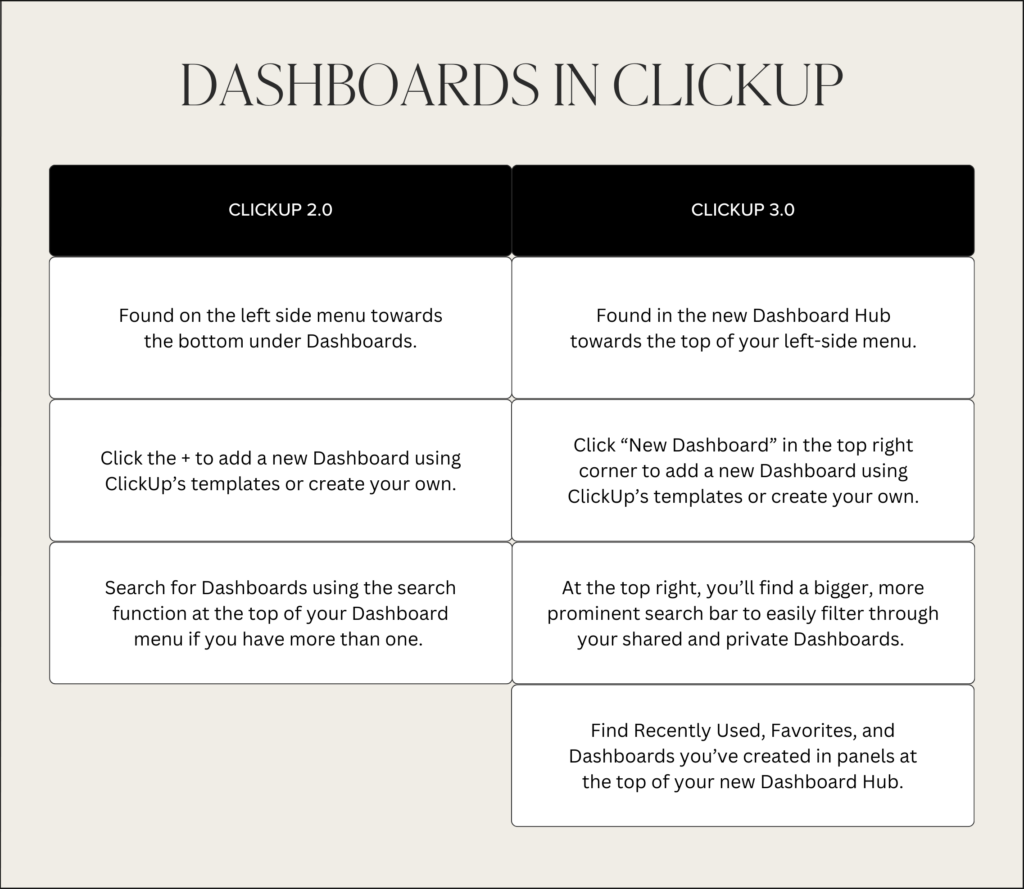
Pro Tip: Dashboards are automatically set to private when you create them, but you can choose to share your Dashboard with other people in your workspace.
The 3.0 update has also added many new features to Dashboards to be able to make them more customizable to your unique business needs, such as:
- Drill Down which allows you to change or update tasks that contribute to the insights on your charts directly from your Dashboard for easy editing.
- Rolling Time Periods allow you to create time ranges on your time-based cards in clear intervals, so you no longer have to keep adjusting your card every week to remove outdated reports.
- Mixed Group Filters are the best way to customize the information you see on your cards. By using “And” and “Or” operators, these filters allow you to zoom in to find only the specific information that you need.
- For those of you who use Sprints, the 3.0 update revealed brand new Sprint Cards, such as Burndown cards, Burnup cards, and Velocity cards to track your Sprints better.
- Coming soon, ClickUp is planning to create an upgraded Task List card (aka their most used card!), so you’ll no longer have to exit your Dashboard to see a List!
How to Use ClickUp Dashboards in Your Business
So, now that we’ve broken down everything you know about Dashboards, you may be wondering, where do I start? When creating ClickUp Dashboards for your business, there are so many different ways to go. However, we recommend starting with these two types of Dashboards to help you get the ball rolling today:
1. Client Project Overview
A Client Project Overview Dashboard gives you and your client information about your client’s project and quick links to any other assets, shared folders, or client portals. You can also access and share the progress of their project in an easy-to-view way. It’s a visual learner’s dream and great for giving clients access to all the goings-on of their projects! Charts can give you a quick and visually appealing way to access any project data that you need.
Meanwhile, all the tasks from their project will be visible (such as what’s done and what’s upcoming), including any specific tasks meant for your client to complete.
2. Team Member Overview
For all my fellow team leaders, you and your team are going to love having a Team Member Overview Dashboard! This dashboard will be your team members’ central hub for knowing exactly what they each need to work on by due date or by priority. Start by creating a task list card so members have one place to see all of the tasks assigned to them. Task widgets can also help track overdue tasks and unread notifications. We also like to create a “What are you behind on?” card that’s perfect for this.
Within this Dashboard, you can also include helpful links for shared folders or other programs, assets, or forms. It’s a great place to link to SOPs or even fully embed docs. Even more, with time tracking widgets, every member will be able to see their hours at a glance.
Pro tip: Don’t forget to set this Dashboard’s widgets to “Me mode” so everyone only sees data that pertains to them.
Other Notable Dashboards
While the above two are a great place to start, we’d be remiss to leave these other honourable mentions off the list:
- Personal Task Management: To show you internal business tasks and client business tasks.
- Internal Project Tracking: Important for tracking specific projects within your business.
- Time Reporting: Great for solopreneurs or when working with a team.
- Leads/Sales Reporting: If you track leads or sales data within ClickUp, you can create a reporting dashboard that gives you an overview of your stats.
Whew! There you have it! Are you convinced yet that Dashboards are the next best thing for collecting and analyzing information in your business? Whether you’re working with a team and want to track tasks or are ready to revolutionize efficiency for your client work, ClickUp Dashboards are a tool built to provide business owners with easy-to-find business insights.
up next

